[Home]
This tutorial demonstrates how to import multiple Excel files into the Personal Data Warehouse, join the data using a view, and create a report.
To begin, download and save the following sample files:
Note: For installation and upgrade details, see Installing and Upgrading.
It's recommended to create separate databases for each project. This makes it easier to back up and restore data.
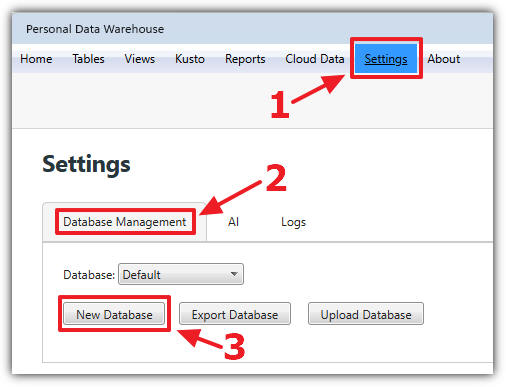
In the Personal Data Warehouse, go to the Settings page, select the Database Management tab, and click New Database.
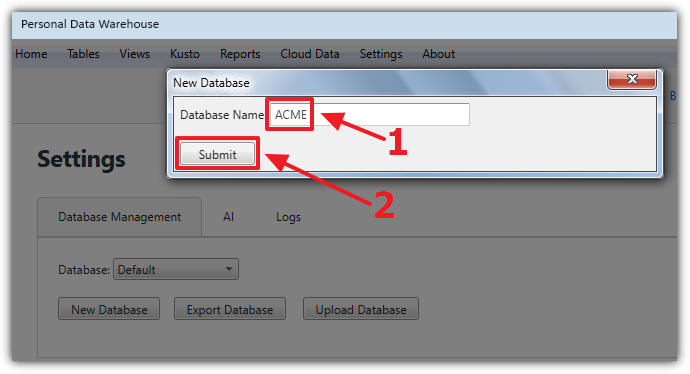
Enter ACME as the database name and click Submit.
Enabling AI allows you to generate code for views, create KQL visualizations, and edit reports with assistance.
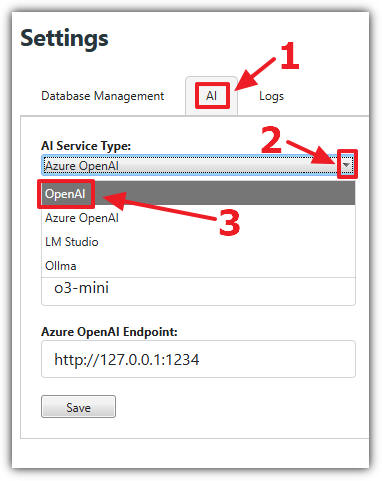
On the Settings page, go to the AI tab, select an AI provider, configure the settings, and click Save.
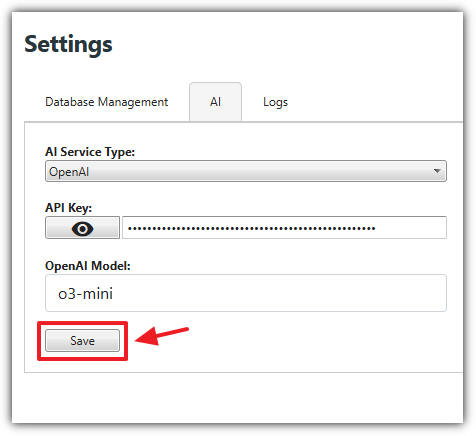
Tip: For optimal performance, use OpenAI with the `03-mini` model or higher.
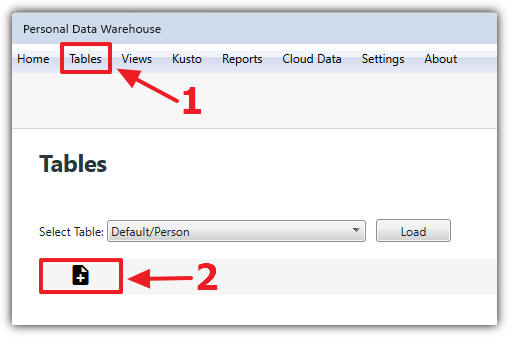
Navigate to the Tables page and click New.
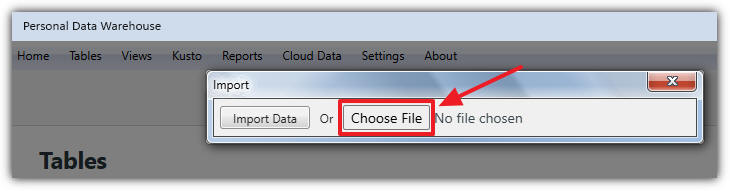
Select Choose File.
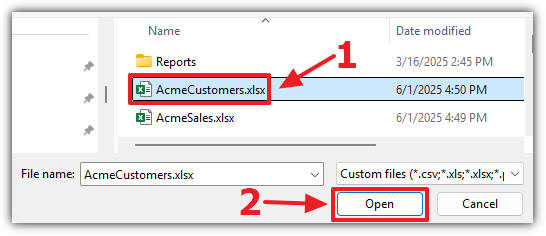
locate the AcmeCustomers.xlsx file, and click Open.
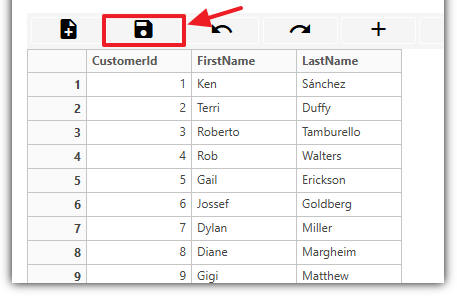
The data will load into a preview grid. Make any necessary changes, then click Save.
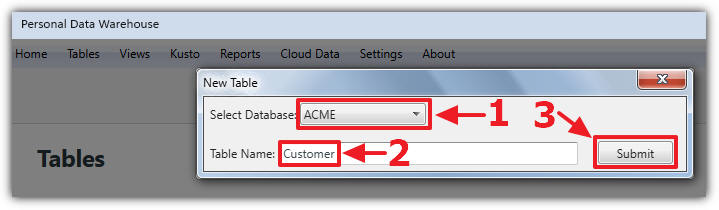
When prompted, select the ACME database, enter Customer as the table name, and click Submit.
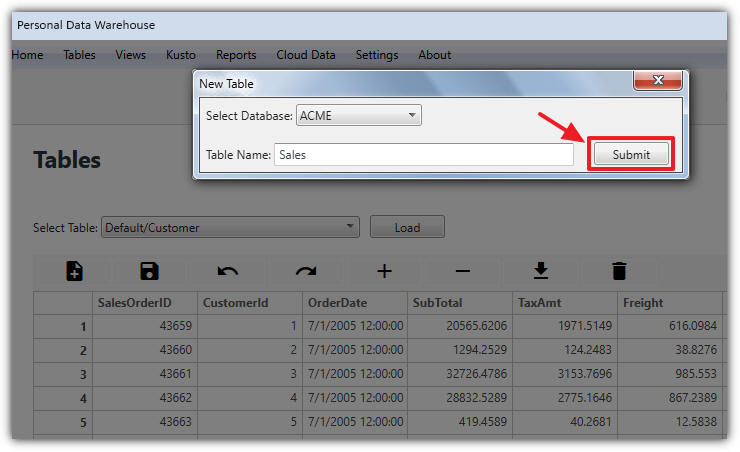
Repeat the steps for AcmeSales.xlsx, saving the table as Sales.
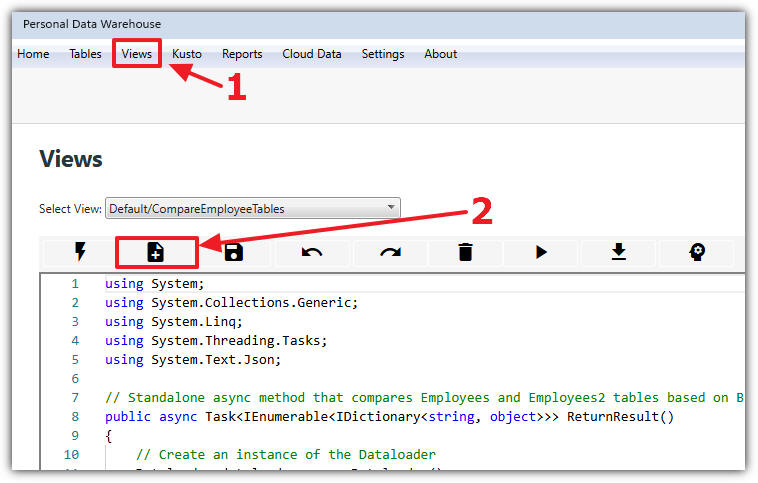
Go to the Views page and click New.
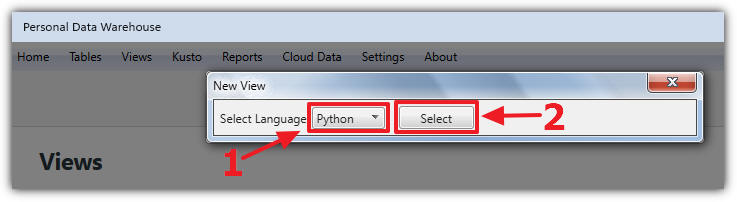
Choose Python as the language and click Select.
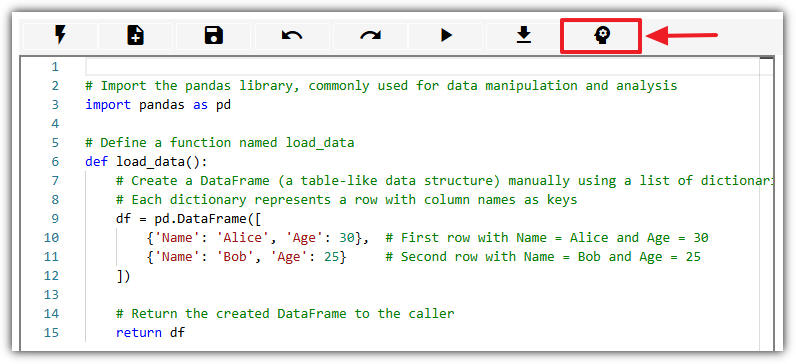
If AI is enabled, click the AI button.
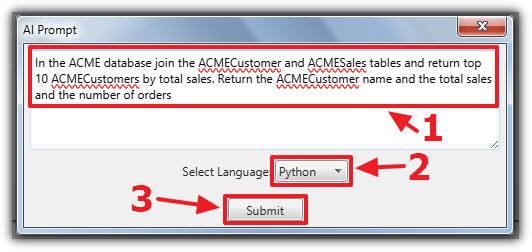
Enter the following prompt:
The AI will generate code similar to this:
 		        # Import the pandas library used for data manipulation
			import pandas as pd

			# Define a function named load_data
			def load_data():

			    # Construct file paths for the ACME Customer and Sales tables
			    customers_filepath = '/ACME/Customer.parquet'
			    sales_filepath = '/ACME/Sales.parquet'

			    # Read the ACME Customer table from its Parquet file
			    df_customers = pd.read_parquet(customers_filepath)

			    # Read the ACME Sales table from its Parquet file
			    df_sales = pd.read_parquet(sales_filepath)

			    # Merge the customer and sales data on the common 'CustomerId' column
			    df_merged = pd.merge(df_customers, df_sales, on='CustomerId', how='inner')

			    # Convert the 'TotalDue' column to numeric, in case it is stored as a string
			    df_merged['TotalDue'] = pd.to_numeric(df_merged['TotalDue'], errors='coerce')

			    # Group by customer information to calculate total sales and order count
			    df_grouped = df_merged.groupby(['CustomerId', 'FirstName', 'LastName']).agg(
			        TotalSales=('TotalDue', 'sum'),      # Sum of TotalDue for each customer
			        OrderCount=('SalesOrderID', 'count')  # Count of orders for each customer
			    ).reset_index()

			    # Create a full customer name by concatenating FirstName and LastName
			    df_grouped['CustomerName'] = df_grouped['FirstName'] + ' ' + df_grouped['LastName']

			    # Sort the customers by TotalSales in descending order to get the highest total sales at the top
			    df_sorted = df_grouped.sort_values(by='TotalSales', ascending=False)

			    # Select the top 10 customers
			    top10_customers = df_sorted.head(10)

			    # Select only the desired columns for the final output
			    result_df = top10_customers[['CustomerName', 'TotalSales', 'OrderCount']]

			    # Return the resulting DataFrame
			    return result_df
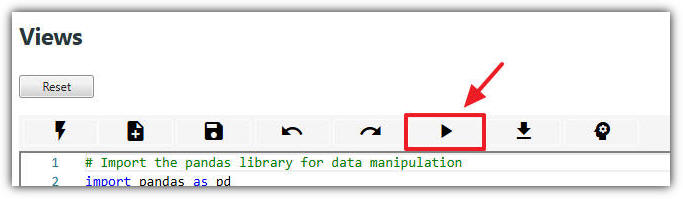
Click Execute to run the script. Since it hasn’t been saved yet, a prompt will appear.
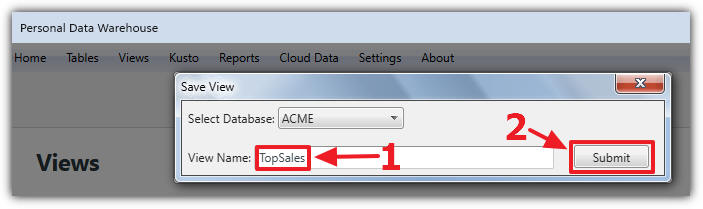
Select the ACME database, name the script TopSales, and click Submit.
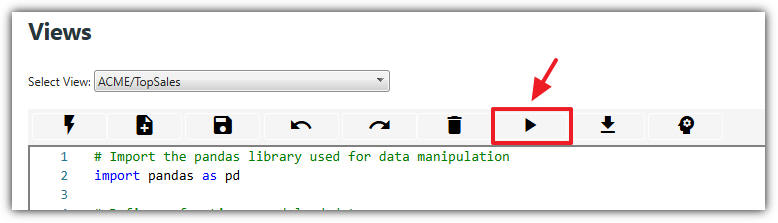
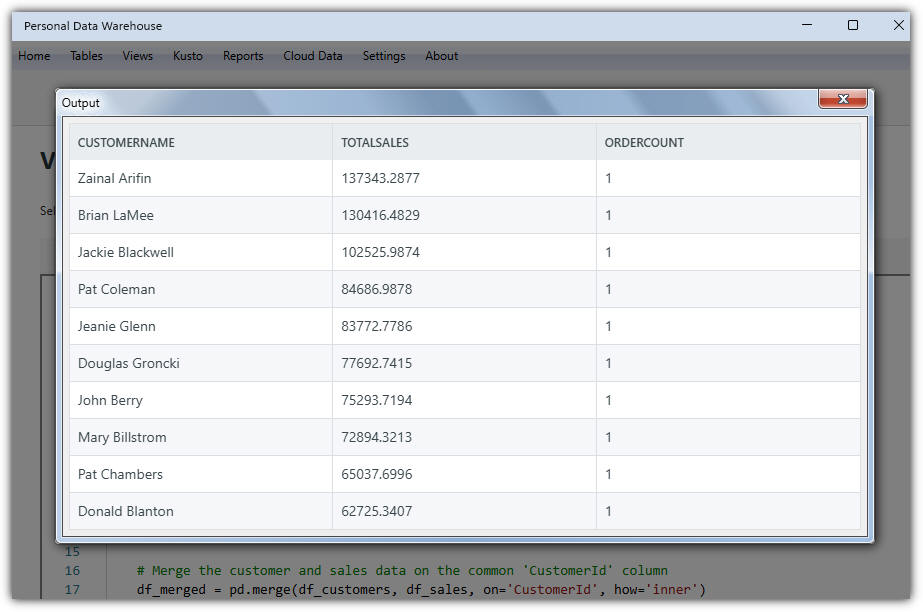
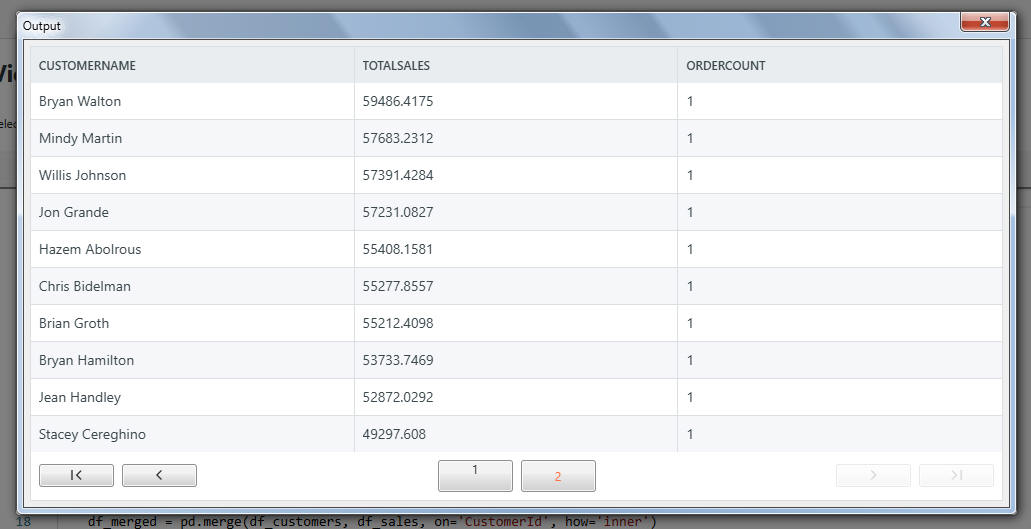
Click Execute again to see the results.
Click the AI button again and enter:
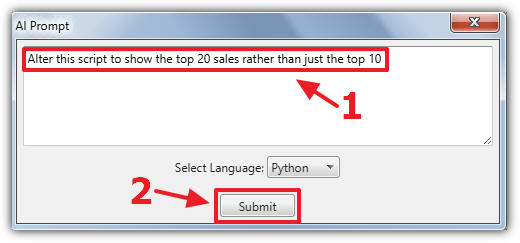
Click Submit to apply changes, then Execute again to view updated results.
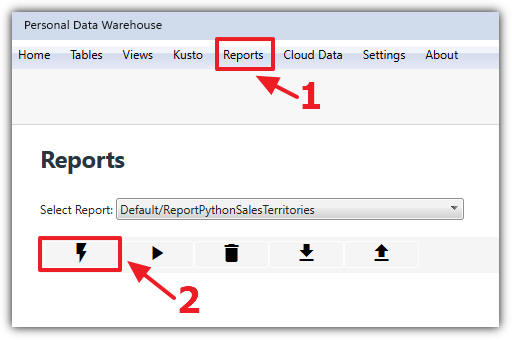
Navigate to the Reports page and click Report Wizard.
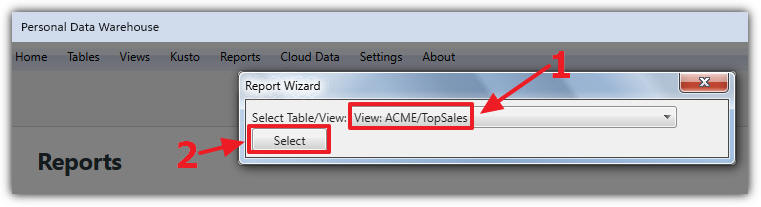
From the dialog, select ACME/TopSales and click Select.
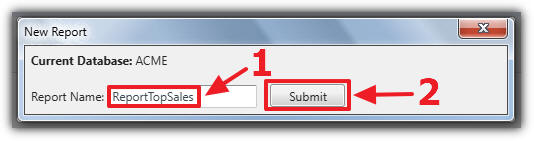
Name the report and click Submit.
Close the confirmation dialog.
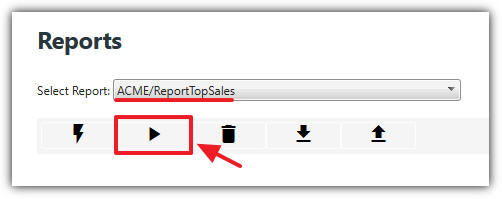
Ensure the report is selected in the dropdown, then click Execute to view it.
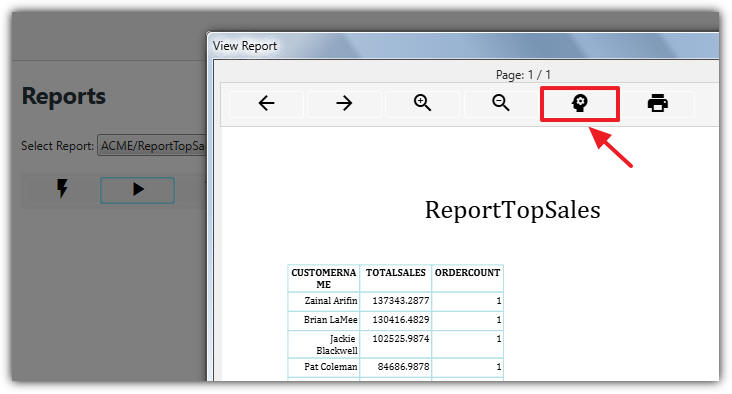
Click the AI button and enter:
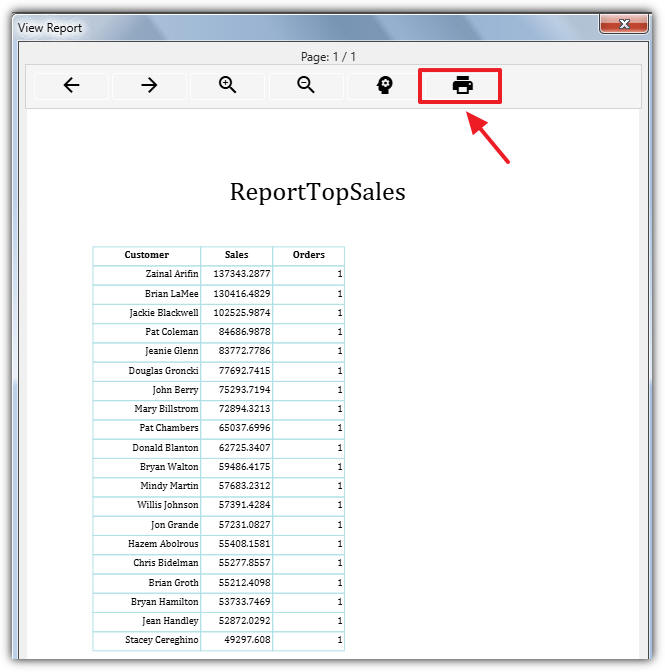
The report will update automatically. You can click Print to print or save the report as a PDF.
Note: For advanced customization, see this video: Using Report Builder to Customize Reports